
Graduation research Chantal Blom – part 3 research report
In this last part of a 3-part series, Chantal Blom talks about her Data Science graduation project at Business Data Challengers.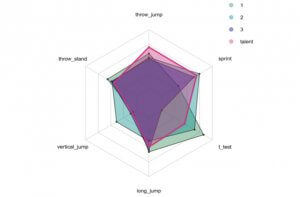
About 3 months ago I talked about the data science graduation project I worked on together with Business Data Challengers and the Dutch Handball Association (NHV).
In this report I will briefly describe the three phases of the project.
1. Data preparation
In this phase we have chosen six physical tests from the data on the basis of which we want to compare talents. It quickly became clear that a certain test (the T-test) had only been done by a part of the talents.
We filled in these missing values. We first clustered the data with the other physical tests. Then we used linear regression to estimate the T-test value of the talents using the other physical tests and the cluster variable.
The output of this phase was a data table with 141 talents and 6 physical test variables.
2. Data analysis
The second phase had as input the data table from the first phase. The goal of this second phase was to find the best model with which talents can be compared. We determined the best model in the way I described in the previous post with k-Nearest Neighbors regression.
The only difference is that instead of looking at a certain number (k) of comparable talents, we can also look at the talents within a distance of a certain talent. For the NHV, we have determined the best distance for comparison in this way.
3. Data visualization
Spider diagram Chantal Blom Data visualization talents
For example, with the best distance we can compare a talent with other talents in the same group. One way to visualize different talents is the spider chart. An example can be seen in the image. The different axes represent different physical tests. The pink talent is the talent we wanted to compare with the rest of the group.
Within the best distance, three talents appeared to fall. A coach can now see in what way the talent still differs from other talents in the group. In the image, it can be seen that the talent still differs in the vertical jump and the T-test. The coach can decide to pay more attention to these aspects during the training.
Conclusion
During this project I learned a lot and that's why I want to thank BDC for this great opportunity. In the meantime I presented the project at the university in Utrecht and now it's time for a vacation!
In September we will visit the NHV at Papendal to present the findings.
Chantal Blom
![]()