Converting data into valuable information is our passion
D3.js Fundamentals
Learn to visualize data with D3.js
Course
| Course form | Classroom or Online |
| Course duration | 3 days |
| Course price | € 995,00 |
| Course locations | Abcoude, Utrecht or Groningen |
Training form
- This training teaches you the most important concepts of D3.js and the ecosystem around it. It is a classroom training focused on as many practical assignments and examples as possible.
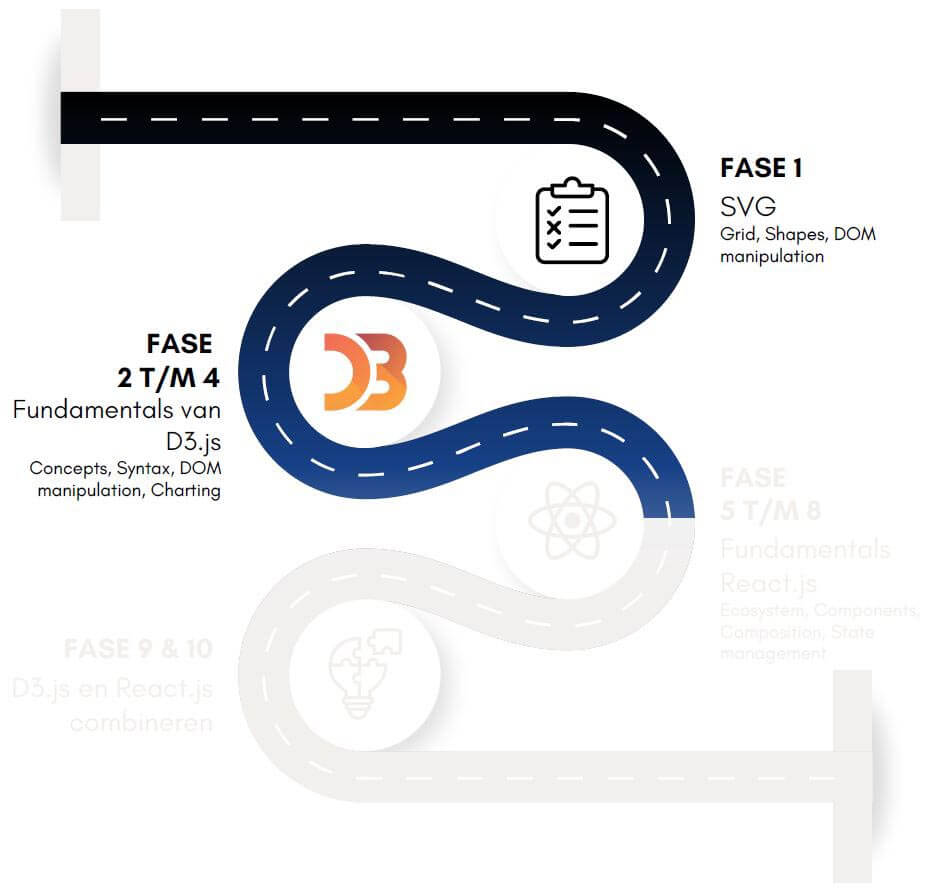
- The training is divided into phases in which the ratio between theory and practice is approximately 25 – 75. The practice consists of partial assignments alternated with classroom discussions of solutions, ideas, concepts and examples.
- Classes usually consist of about 6 participants. We use this deliberately, this ensures that the instructor can give a lot of personal attention. In addition to the instructor, there may be a second BDC-er present to assist.
This training is suitable and interesting for companies and developers who want to unlock data and information via the web in the form of clear and recognizable visualizations. These can be expanded to entire applications or dashboards. Participants are mainly interested in data visualization. After the training, the interest will hopefully have flared up into a passion! Some prior knowledge is required to be able to follow the material.
For this training you need knowledge and experience with JavaScript, HTML and CSS, at least at the level of the JavaScript Fundamentals training from BDC Academy or third parties. During the training it is assumed that this basis is present with the participants. Experience with JQuery is useful, because of the similar syntax (chaining) that D3.js uses.
The goal of the training is to learn how to visualize data with D3.js.
After completing this training:
- Do you know what SVG is and why it is used in combination with D3.js?
- Know what D3.js is and how to use it to develop data visualizations for the web.
- Have you built different types of data visualizations (graphs) using SVG and D3.js?
Planning & Registration – D3.js Fundamentals
Dates and locations
| Start time | Location | Training form |
| Monday September 19 | Abcoude | Classical |
| Monday October 17th | Abcoude | Classical |
| Monday November 21st | Abcoude | Classical |
| Monday December 12th | Abcoude | Classical |

Goal #1
30%
Learn SVG
Goal #2
70%
Learn D3.js
Goal #3
100%
Create kick-ass visualizations
Any questions…? Ask the teacher.


