Converting data into valuable information is our passion
Data visualization with React.js and D3.js
Learn to visualize data and build web applications with React.js and D3.js
Course
| Course form | Classroom or Online |
| Course duration | 3 days + 2 days |
| Course price | € 1495,00 |
| Course locations | Abcoude, Utrecht or Groningen |
Training form
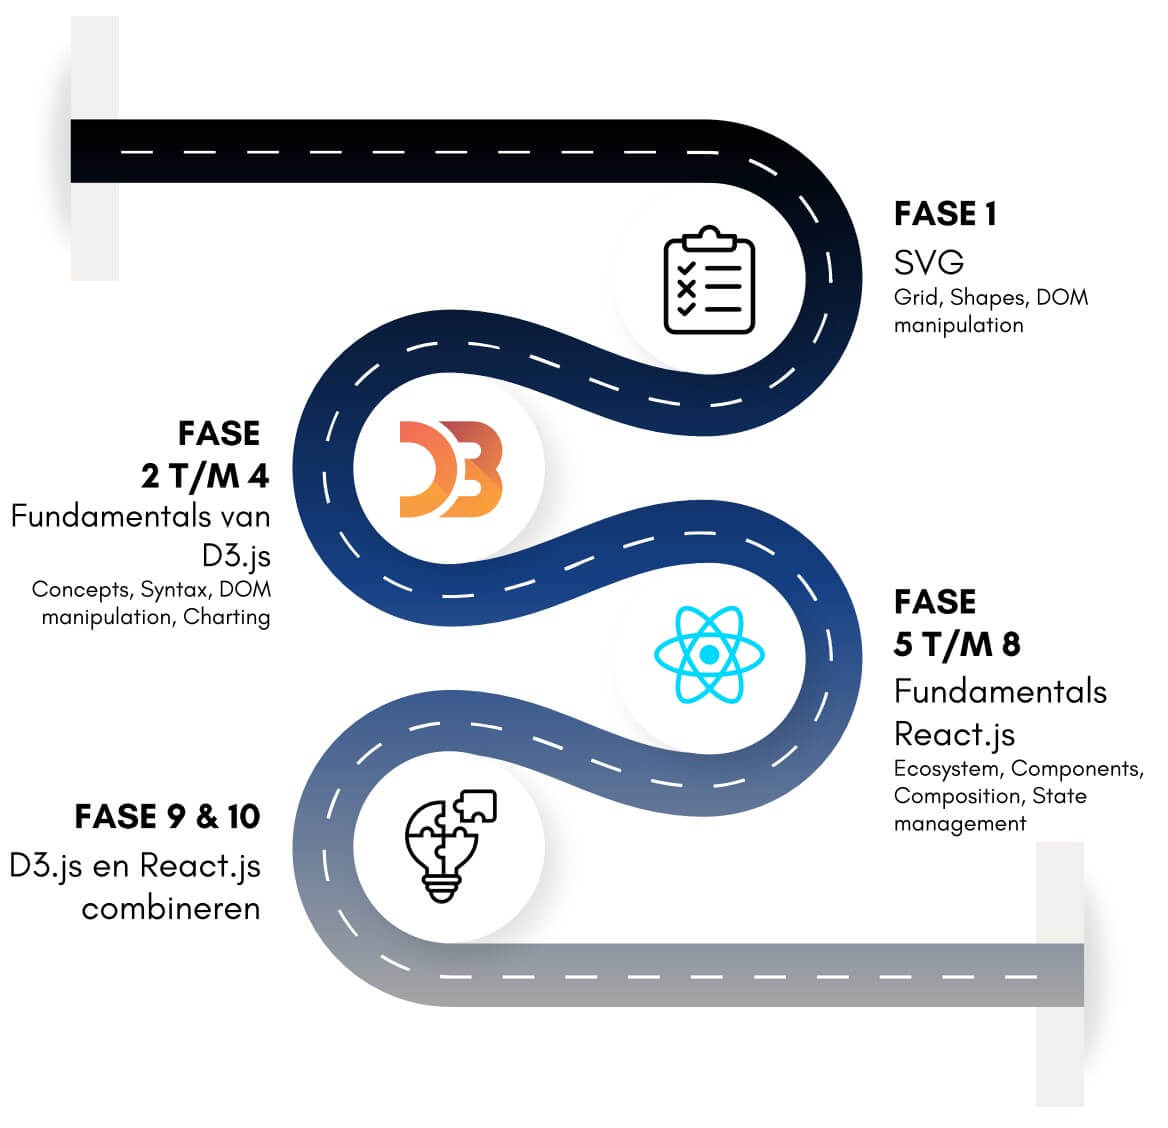
- This training will teach you the key concepts of React.js and D3.js and its ecosystem
around it. It is a classroom training focused on as many practical assignments as possible and
examples.
- The training is divided into phases in which the ratio between theory and practice is approximately 25 – 75
is. The practice consists of partial assignments alternating with class discussion of
solutions, ideas, concepts and examples.
- Classes usually consist of about 6 participants, which ensures a lot of personal attention
can be given by the instructor. In addition to the instructor, there may be a second BDC present to assist.
Dates and locations
| Start time | Location | Training form |
| To be determined | ||

Goal #1
40%
Learn D3.js
Goal #2
40%
Learn React.js
Goal #3
20%
Combine D3.js and React.js
Goal #4
100%
Create kick-ass visualizations
Any questions…? Ask the teacher.


